CLIENT
WHAT WE DID
Data Analysis
OBJECTIVE
Columbus Airports needed a clear, concise method to evaluate their performance, amidst a deluge of feedback from sources like JD Power, ASQ, social media, and emails. They turned to O.Y.E. for a holistic solution to assess their standing in the eyes of the public.
APPROACH
O.Y.E. developed a comprehensive dashboard providing a bird’s-eye view of customer experience scores and comments, identifying trends that positively and negatively impacted the customer experience.
This dashboard included:
- Topic analysis of all categories (i.e. transportation, security, airlines, etc.) that drive customer inquiries across all channels
- Subcategory identification to highlight top conversation drivers within these categories
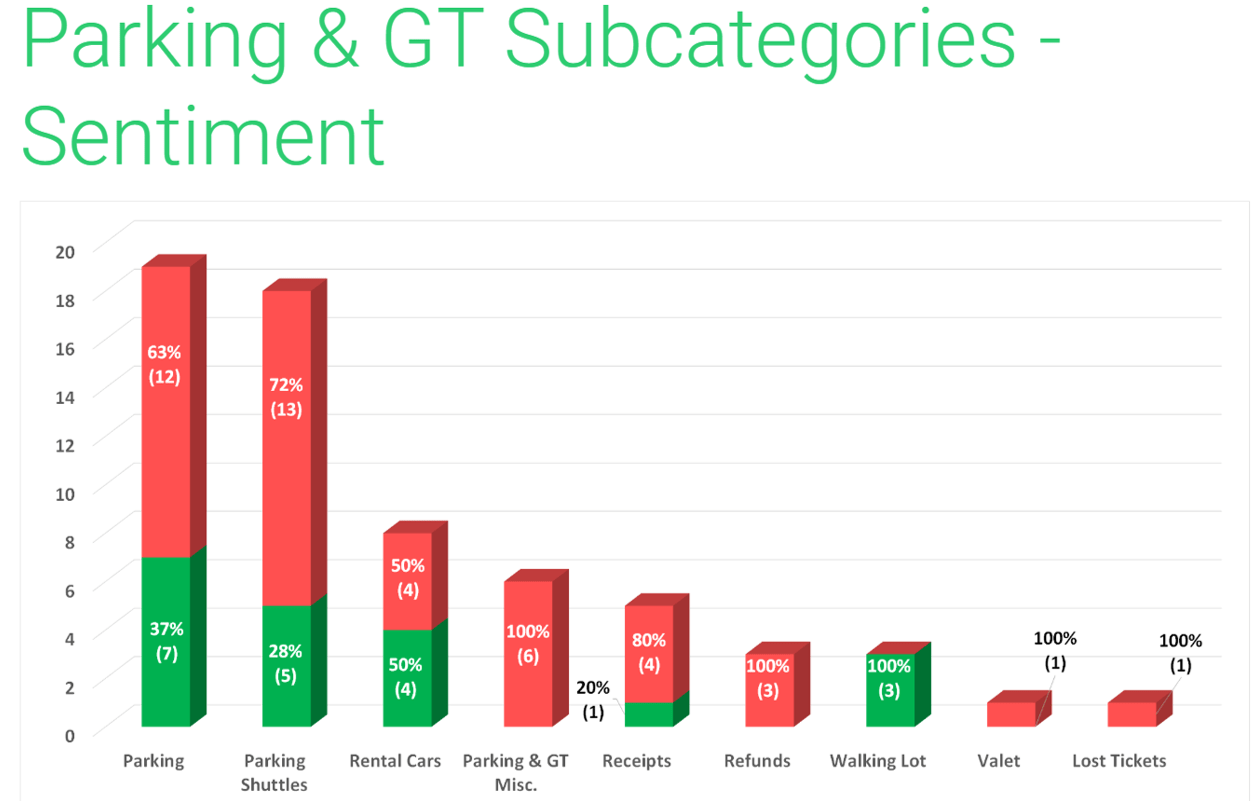
- Sentiment analysis for each topic
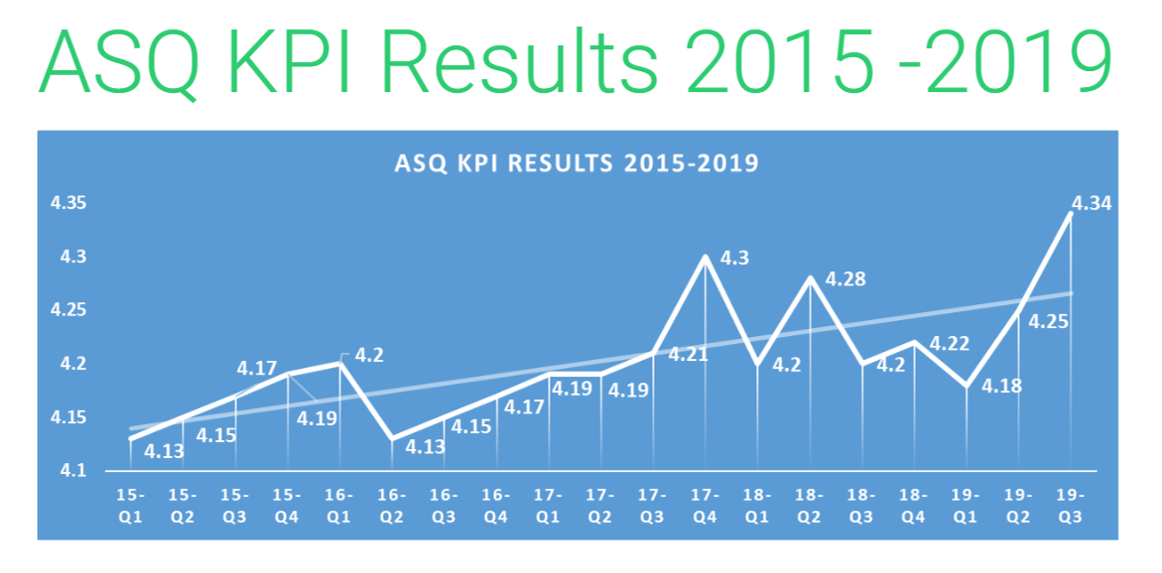
- Summary of 5 years of ASQ and JD Power Survey results
STRATEGY & EXECUTION
Through this custom dashboard, Columbus Airports could pinpoint specific areas for improvement across their operations.
Key insights included:
- General information about the Airport made up 33% of all customer inquiries, surpassing Parking (26%) and TSA (16%)
- Overall sentiment was 63% positive, but services and Parking/Ground Transportation showed only 29% and 31% positive sentiment respectively
- Within Parking/Ground Transportation, parking shuttles generated 72% negative sentiment and accounted for over one-fifth of conversations in this category
- Identification of upward trends in both JD Power and ASQ customer survey scores through 2019
IMPACT
With O.Y.E’s dashboard, Columbus Airports could clearly identify improvement opportunities across their business. These insights guided efforts to enhance customer satisfaction, streamline operations, and maintain a positive reputation. The actionable data ensured Columbus Airports could make informed decisions, supporting their goal of delivering exceptional customer experiences.


WE KNOW SOMETHING ABOUT YOUR CUSTOMERS YOU DON'T.
Find out what it is…and so much more.

